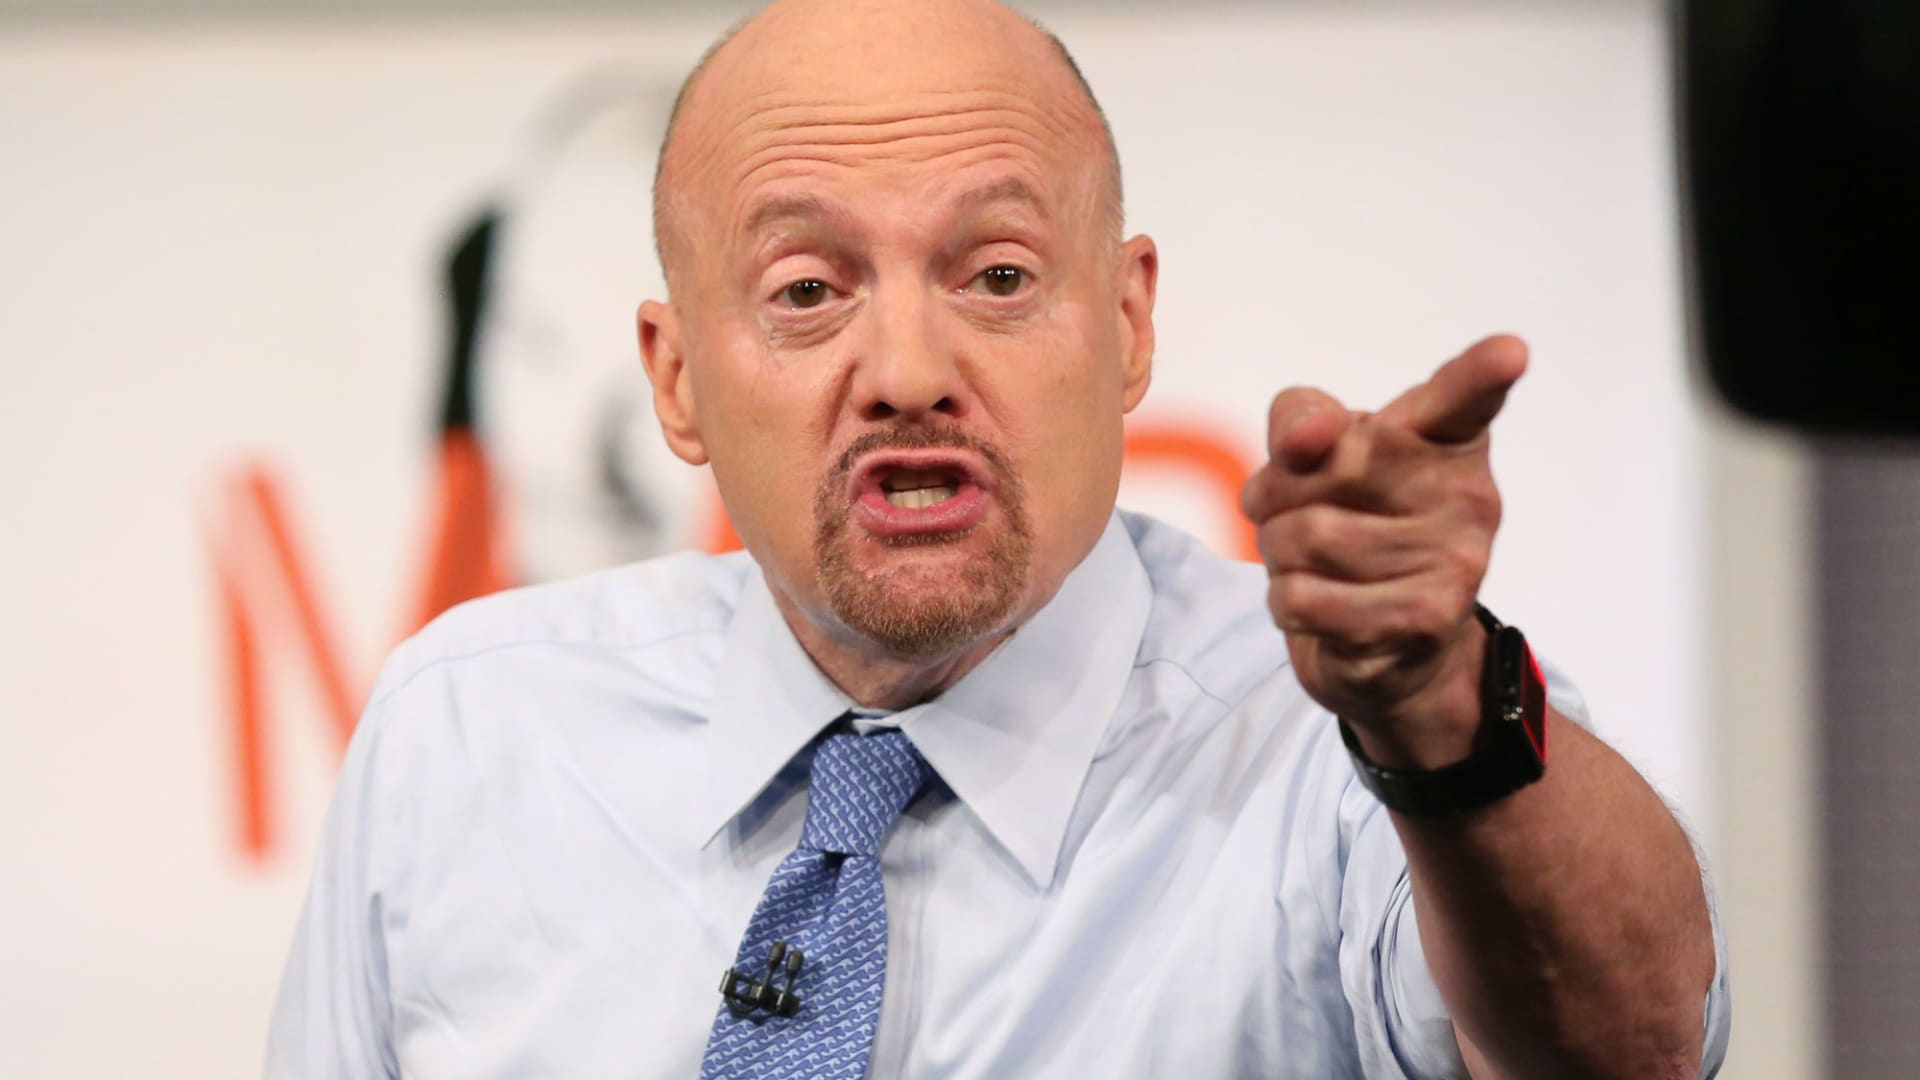
CNBC’s Jim Cramer on Friday explained fresh technical analysis from veteran chartist Larry Williams that signals the market is headed for a bottom.
“I know it’s tough to believe anything positive at this moment, but I said the same thing in April 2020, and that’s when Larry Williams made one of the best bottom calls I’ve ever seen,” the “Mad Money” host said, referring to when the market spiraled after the onset of the Covid pandemic sent shockwaves through the global economy.
“He says this is it. … I wouldn’t bet against him. I trust his predictions more than I despise this market, and I say that as someone who really does hate the tape,” he added.
Cramer started off his explanation of Williams’ analysis by examining the S&P 500 futures chart.
The futures line is in black and the advance/decline line, a cumulative indicator measuring the number of stocks going up on a daily basis versus the number going down, is in blue, Cramer said.
Williams views the advance/decline line as an indicator of the market’s internal strength or weakness, according to Cramer.
“Right now, you can see that while the S&P spent the last week getting smashed into oblivion, the advance/decline line has been holding up much better. In fact, it’s steadily worked its way higher,” he said.
He noted that that pattern – when an important indicator goes the opposite way of an index – is called a bullish divergence. “According to Williams, this action in the advance/decline line is incredibly positive for the market. It tells you that, from the perspective of breadth, the worst of this decline may be behind us,” Cramer said.
Next, Cramer inspected the daily S&P futures chart plotted with the on-balance volume index in purple. The chart reveals that the volume of trading has already started to “dry up on the sell side,” Cramer said.
He noted that the on-balance volume index is a cumulative indicator that measures volume flow by adding the volume on up days and subtracting on down days.
“We care about this because volume’s like a polygraph test for technicians: High volume moves are telling the truth. Low volume moves [are] often misleading,” he said.
And because the on-balance volume line has held up despite the S&P reaching new lows, the chart is consistent with what Williams would expect to see in “a down market where some major money managers have finally just started buying stocks more aggressively,” Cramer said.
He also showed a chart showing S&P 500 futures plotted with Williams’ insider activity indicator, in green.
“Look at the bottom of the chart – this is Williams’ … commitments of traders index, which shows you what professional money managers are doing with their futures positions,” Cramer said. “Even though the market’s down, Williams sees the professionals buying here, and that often sets up significant rallies,” he added.
Finally, Williams observed the dominant cycles for the S&P 500, which typically run for 75 days.
“Right now, that cycle says the S&P is ready to run … and if the cycle holds, Williams would expect it to keep running through mid-to-late June,” Cramer said.


