Charts suggest investors should brace themselves for declines in the S&P 500, Cramer says

Charts suggest investors should brace themselves for declines in the S&P 500, Cramer says


Charts suggest investors should brace themselves for declines in the S&P 500, Cramer says

CNBC’s Jim Cramer on Monday warned investors to brace for market turbulence ahead by consolidating their portfolios.

“The charts, as interpreted by Carolyn Boroden, suggest that the incredible rally in the S&P 500 might be running out of steam,” he said, adding, “She’s not necessarily saying we’re headed for a brutal near-term decline, but you might want to pull in your horns for the next few weeks.”

related investing news

Markets may be taking the wrong read from January's shocking jobs report

CNBC Pro

Stocks fell on Monday as investors took profits after the stock market’s strong start to the year. The S&P 500 is up more than 7% this year.

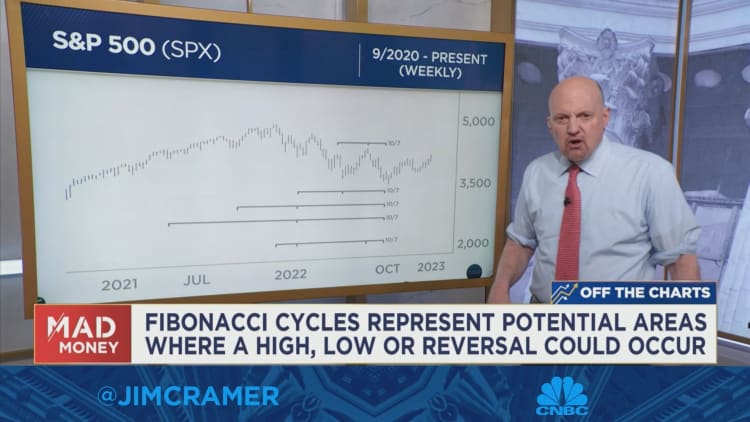
Cramer first explained that Boroden measures past swings in a stock or index and determines key levels by running them through Fibonacci ratios, which technicians use to spot patterns that can signal when a stock or other security could shift directions. 

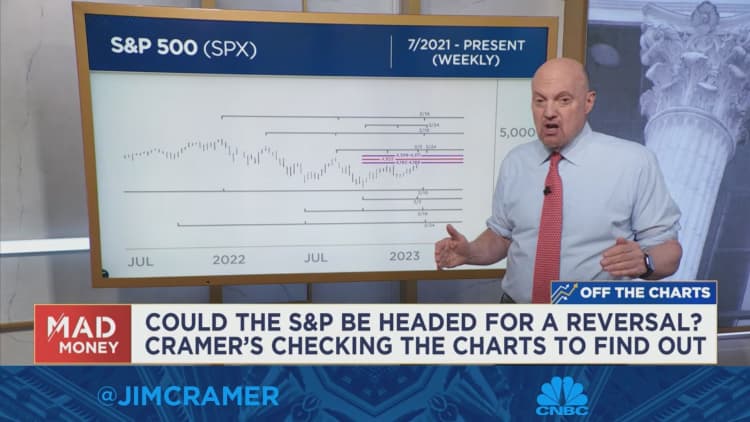
A cluster of Fibonacci timing cycles clustered together is a sign that “something big” could happen, he added. To explain Boroden’s analysis of the S&P 500, Cramer examined the weekly chart of the index going back to July 2021.

She sees six Fibonacci time cycles coming due in this week, which means the odds of a bearish reversal are higher than she’d like, according to Cramer. He added that there are three more timing cycles coming due near the end of the month, in the week ending on Feb. 24.

“Boroden also says that when you look at the daily chart, you’ve got similar timing cycles that are forecasting the same thing … a meaningful pullback,” Cramer said.

He said that while these signs don’t guarantee a reversal, Boroden does believe that investors should prepare themselves for the possibility that February could be a tough month for the market.

“She recommends watching for any sell signals so you can ring the register and protect your profits,” he said.

For more analysis, watch Cramer’s full explanation below.

Jim Cramer explains new charts analysis from Carolyn Boroden

Jim Cramer’s Guide to Investing

Click here to download Jim Cramer’s Guide to Investing at no cost to help you build long-term wealth and invest smarter.


Source

On Holding beats first-quarter expectations, sees double-digit growth in China as Nike lags
Business

On Holding beats first-quarter expectations, sees double-digit growth in China as Nike lags

Swiss sneaker company On saw more strong growth during its first quarter, beating Wall Street’s expectations on the top and bottom lines even as direct-to-consumer revenue fell short of forecasts.  During the quarter ended March 31, On’s direct-to-consumer sales, revenue from its own website and stores, grew 16.4% to 322.3 million francs ($414.2 million), falling […]

Read More
GM cutting hundreds of salaried IT workers as it trims costs, evaluates needs
Business

GM cutting hundreds of salaried IT workers as it trims costs, evaluates needs

The General Motors global headquarters in Detroit, Jan. 12, 2026. Jeff Kowalsky | Bloomberg | Getty Images DETROIT – General Motors is laying off hundreds of salaried employees in its information technology operations as the automaker reevaluates its workforce needs and cuts costs, CNBC has learned. The global reductions began Monday and will impact about […]

Read More
The wealthy keep buying Manhattan real estate despite potential pied-à-terre tax
Business

The wealthy keep buying Manhattan real estate despite potential pied-à-terre tax

Central Park Tower, center, along Billionaire’s Row in New York, US, on Friday, May 1, 2026. Michael Nagle | Bloomberg | Getty Images High-end real estate sales in Manhattan increased in the past month, according to new data, despite New York Mayor Zohran Mamdani’s proposed pied-à-terre tax that brokers warn could cause a wealth flight. […]

Read More