Charts suggest investors should brace themselves for declines in the S&P 500, Cramer says

Charts suggest investors should brace themselves for declines in the S&P 500, Cramer says


Charts suggest investors should brace themselves for declines in the S&P 500, Cramer says

CNBC’s Jim Cramer on Monday warned investors to brace for market turbulence ahead by consolidating their portfolios.

“The charts, as interpreted by Carolyn Boroden, suggest that the incredible rally in the S&P 500 might be running out of steam,” he said, adding, “She’s not necessarily saying we’re headed for a brutal near-term decline, but you might want to pull in your horns for the next few weeks.”

related investing news
Markets may be taking the wrong read from January's shocking jobs report

CNBC Pro

Stocks fell on Monday as investors took profits after the stock market’s strong start to the year. The S&P 500 is up more than 7% this year.

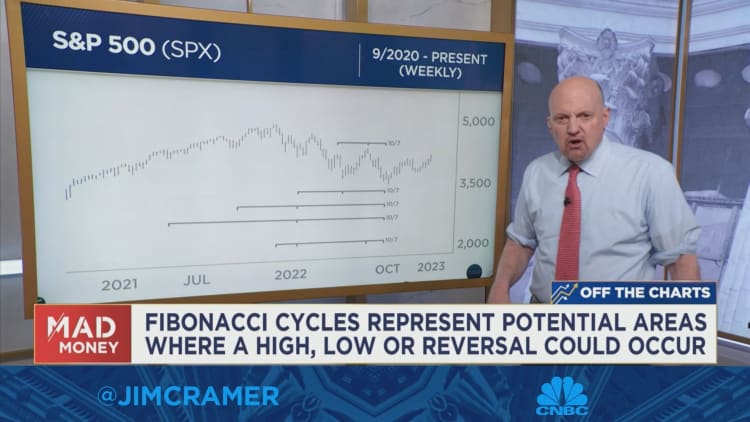
Cramer first explained that Boroden measures past swings in a stock or index and determines key levels by running them through Fibonacci ratios, which technicians use to spot patterns that can signal when a stock or other security could shift directions. 

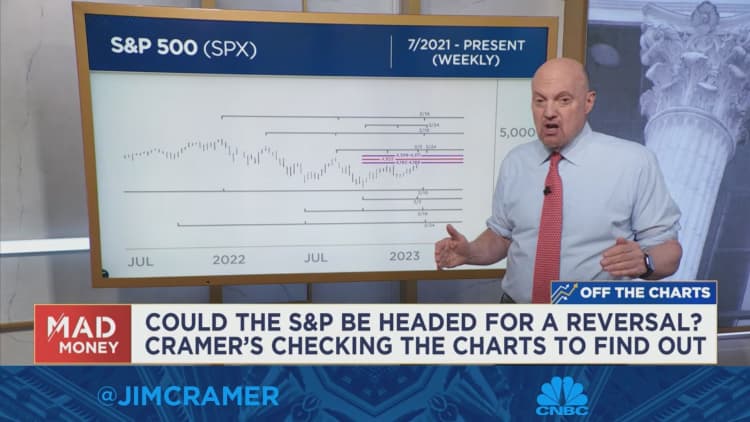
A cluster of Fibonacci timing cycles clustered together is a sign that “something big” could happen, he added. To explain Boroden’s analysis of the S&P 500, Cramer examined the weekly chart of the index going back to July 2021.

She sees six Fibonacci time cycles coming due in this week, which means the odds of a bearish reversal are higher than she’d like, according to Cramer. He added that there are three more timing cycles coming due near the end of the month, in the week ending on Feb. 24.

“Boroden also says that when you look at the daily chart, you’ve got similar timing cycles that are forecasting the same thing … a meaningful pullback,” Cramer said.

He said that while these signs don’t guarantee a reversal, Boroden does believe that investors should prepare themselves for the possibility that February could be a tough month for the market.

“She recommends watching for any sell signals so you can ring the register and protect your profits,” he said.

For more analysis, watch Cramer’s full explanation below.
Jim Cramer explains new charts analysis from Carolyn Boroden

Jim Cramer’s Guide to Investing

Click here to download Jim Cramer’s Guide to Investing at no cost to help you build long-term wealth and invest smarter.


Source

WNBA renews media rights deal with Scripps
Business

WNBA renews media rights deal with Scripps

Caitlin Clark #22 of the Indiana Fever brings the ball up court during the first half of a WNBA game against the Chicago Sky on August 30, 2024 at Wintrust Arena in Chicago, Illinois.  Melissa Tamez | Icon Sportswire | Getty Images The WNBA and E.W. Scripps announced on Friday a new, multi-year media rights […]

Read More
Shares of scandal-plagued Brazilian meat giant JBS open at .65 in U.S. public debut
Business

Shares of scandal-plagued Brazilian meat giant JBS open at $13.65 in U.S. public debut

The JBS Greeley meatpacking facility in Greeley, Colorado, US, on Friday, Feb. 28, 2025. Chet Strange | Bloomberg | Getty Images Shares of Brazilian meat giant JBS made their U.S. public market debut on Friday, opening at $13.65 a share. The opening trade values the company at roughly $30 billion, outstripping rival Tyson Foods’ market […]

Read More
Airlines divert, cancel flights after Israel’s strike on Iran closes airspace in Middle East
Business

Airlines divert, cancel flights after Israel’s strike on Iran closes airspace in Middle East

Zoom In IconArrows pointing outwards Flight map of the Middle East after Israel airstrikes on Iran at 12:25 UTC on June 13th, 2025. FlightRadar24 Airlines around the world canceled flights to Israel and were skirting a large swath of airspace in the Middle East on Friday after Israel’s overnight missile strike on Iran. Iran later […]

Read More